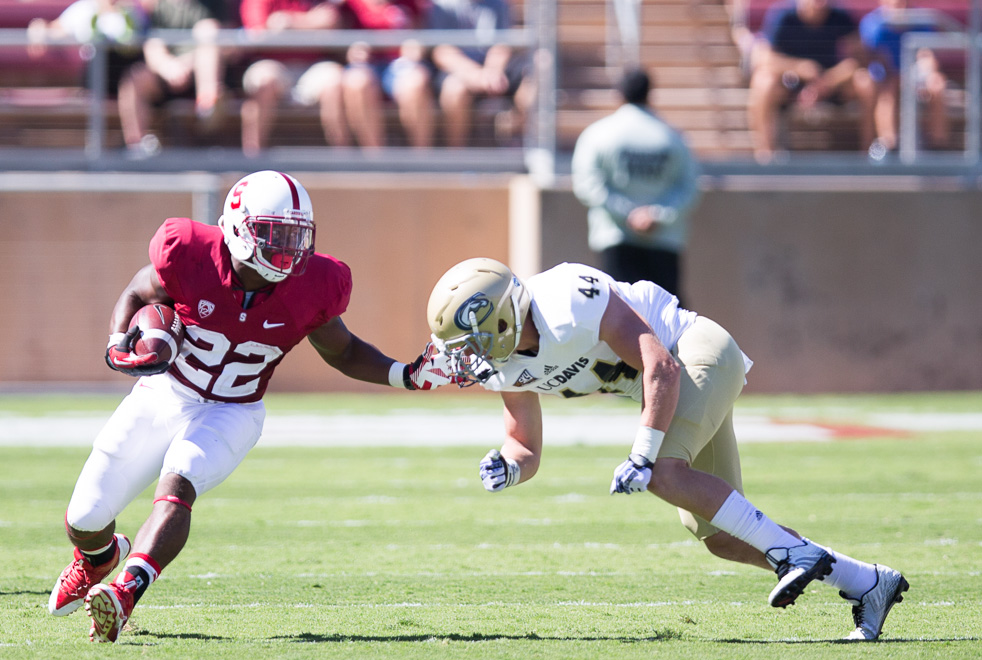
If you’re a Stanford football fan, chances are that you needed a hug after Saturday’s rain-soaked affair in South Bend.
Ugly, sloppy and painful are just a few words to describe what went down in Notre Dame Stadium. Put aside the fact that Stanford was one stop away on a fourth-and-11 with 61 seconds remaining from coming away with a “W.” Flipping field position seemed to be more important than scoring points through the first three quarters, and over the course of the game, the teams combined to go 11-of-34 on third down, punted 14 times and turned the ball over four times.
Perhaps it was nothing more than a quixotic dream that “execution” — the one word that was repeated ad nauseam leading up to gameday by The Daily’s football writers and the Cardinal players — would characterize Stanford’s offensive performance on Saturday, especially in the foreign climate of the Midwest. Forty-one degrees with a sustained downpour are tough conditions for any team, seriously speaking.
Let’s take a look at some of the key numbers from the game, which are possibly more depressing to read than what we witnessed on the field:
3.0: Average yards per play for Stanford’s offense against Notre Dame. It was the lowest single-game mark for the team since Oct. 21, 2006, when it averaged just 2.6 yards per play against Arizona State in Tempe, Arizona. That was in the midst of a 1-11 season, the last one before Jim Harbaugh arrived on the Farm and started the transition from rags to roses.
The Cardinal were outgained 370 to 205 in total offensive yardage, and simply never seemed in rhythm until their nine-play, 58-yard touchdown drive in the fourth quarter that gave them a short-lived 14-10 lead. As a result, fifth-year senior punter Ben Rhyne was one of the busiest players on the team on Saturday. He punted eight times in the game, the most in a game for Stanford since the Sept. 27, 2012 loss to Washington.
47: Total yards rushing for the Cardinal offense. If you’re already sick of the “most/fewest since…” statistics, sorry, there’s one more coming: Saturday’s game was the first time Stanford had been held to under 50 yards rushing since Oct. 27, 2007, in a loss to Oregon State.
While there is a caveat that this statistic also takes into account the 34 yards lost on the four Notre Dame sacks of senior quarterback Kevin Hogan, even taking away Hogan’s numbers leaves 63 yards rushing on 25 carries (2.5 yards per carry) for the rest of the Cardinal running backs. Especially in the poor throwing conditions, when the team needed their ground game to spark the offense, the only things sparked were long-lost memories of Tyler Gaffney’s downhill running ability from the 2013 season.
18-for-36: Hogan’s completions-to-attempts ratio in Saturday’s game. Yes, the weather was a huge factor for both quarterbacks. Throwing downfield was difficult — only six of Hogan’s 18 completions went for more than 10 yards. Drops by the Stanford wide receiver corps were crippling. But the one aspect completely in Hogan’s control is decision-making, which was an issue against Washington and left much to be desired on Saturday as well.
Hogan’s conservative strategy sometimes works to the team’s advantage, but at other times results in seemingly predetermined passes and staring down receivers. Dangerous throws to Montgomery, who seemed to be blanketed in double coverage for most of the game, have been an emerging trend.
9 for 66: Stanford’s number of penalties and total yards penalized for against the Irish. On Saturday, the tone was set right from the start, as the offense was called for false starts three times in the first quarter. Another disturbing trend for the Cardinal in an area almost completely under their control has been the surge in the amount of penalties they’ve committed. Take a look at the amount of penalties committed per game through five games this season compared to last season’s numbers, both overall and specifically on the road or in neutral site games:
| Overall | Road/Neutral | |||
| Pen./G | Yds./G | Pen./G | Yds./G | |
| 2013 | 5.3 | 44.6 | 6.1 | 49.0 |
| 2014 | 6.4 | 57.8 | 8.5 | 75.5 |
241: Notre Dame’s total yards passing against the Cardinal defense. While Stanford’s defense was really the only reason why the team was still in the game towards the end, a botched coverage in the secondary with 61 seconds remaining ultimately provided the margin of victory for the Irish.
Stanford’s pass defense, which had allowed 296 yards in the air over the team’s first four games combined, suffered a few lapses against quarterback Everett Golson, which are unfortunately those that stand out the most in such a tight game.
Contact Jordan Wallach at jwallach ‘at’ stanford.edu.
