
Last updated July 28 at 12:00 a.m. PT
As cases of COVID-19 continue to develop in the Bay Area and at Stanford, The Daily is tracking the number of cases, including their reported causes and outcomes. All Santa Clara County data comes from daily reports by Santa Clara County Public Health and is available in full on the Stanford Open Data Portal. Other counties’ data are collected from their respective public health sites and are also available on the Stanford Open Data Portal. Check our live blog for updates on the coronavirus outbreak and Stanford’s response. For each of visualizations below, feel free to use the arrows in the top right corner to navigate to different views of the depicted data.
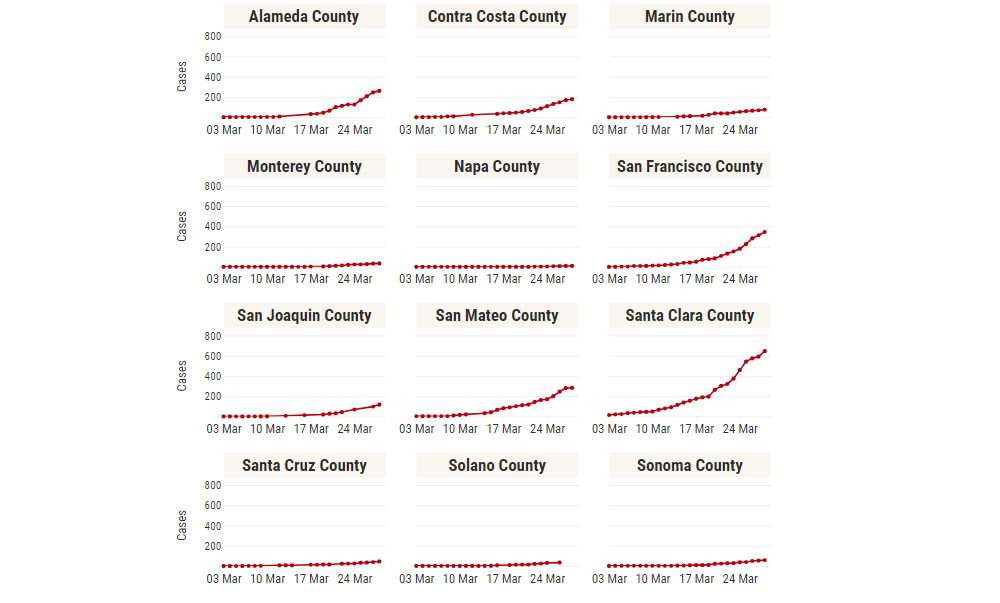
Bay Area COVID-19 Cases
Out of the Bay Area counties, San Joaquin County has surpassed Alameda County and Santa Clara County with the most cases, currently at 10,675 confirmed cases. Napa County has the fewest, at 766 confirmed cases. When adjusting case counts to each county’s population, San Joaquin County has the largest case density, with about 1,432 confirmed cases per 100 thousand residents. Since early to mid-June, confirmed case growth across the Bay Area has been increasing, growing the most in the counties of San Joaquin, Marin and Monterey over the past two weeks.
Santa Clara County COVID-19 Cases
Note: On April 20, Santa Clara County Public Health updated their methodology for assigning dates to confirmed cases of COVID-19. Rather than reporting the date of when confirmed positive result were reported to the California Reportable Disease Information Exchange (CalREDIE) system, cases are now reported “by the date of specimen collection.” All Santa Clara County visualizations have been updated with this new data. We update the present case count daily and refresh all data every Monday to reflect any changes in past case counts.
Outcomes & Causes
Before April, the number of currently hospitalized individuals had been steadily growing alongside non-hospitalized cases of COVID-19 in Santa Clara County. When April recently began, however, currently hospitalized cases started to stagnate at around 280 hospitalizations and began to decrease and halved by the start of May. Hospitalizations have remained under 100 since mid-May. Fortunately, COVID-19-related hospitalizations do not seem to be a major factor in causing Santa Clara County hospital beds to be at full capacity, although ICU beds are seeing significantly increased occupancy due to COVID-19.
The cause of infection in Santa Clara County seems to have begun with a relatively tiny spike in international travel, where other case causes were due to close contact with known cases. Afterwards, international travel became a minor cause of contracting COVID-19. Presumed community transmission and close contact with known cases quickly overtook as the leading and fastest growing causes. Starting on March 25, SCC Public Health stopped tracking case causes, citing the recent influx of newly confirmed cases as being “likely associated with community transmission.” Santa Clara County Public Health told The Daily on March 29 that it plans “to release additional elements of [its] data dashboard in the coming days.” Until then, we have frozen our reported causes visualizations.
To mitigate these causes, most Bay Area counties, including Santa Clara, announced “shelter in place” orders to begin on March 17. The state of California quickly followed two days later. With several other states issuing equivalent statewide directives, one in four Americans is now under “shelter in place” or “stay at home” orders. Over the course of late May and early June, these orders were relaxed.
Demographics
On April 9, Santa Clara County Public Health began reporting the race/ethnicity breakdown of confirmed deaths. The above chart shows the share of confirmed deaths for each race/ethnicity. Also shown is the share of each race/ethnicity in Santa Clara County as a whole estimated by the U.S. Census’s 2018 American Community Survey (ACS). The data show that Asian people represent a relatively smaller share of confirmed deaths compared to their share of the population, whereas Latinx/Hispanic people represent a relatively larger share of confirmed deaths compared to their share of the population.
Furthermore, on March 25, Santa Clara County began reporting the age breakdown of confirmed cases. To give context, the age distribution of Santa Clara County is provided as estimated by the U.S. Census’s 2017 American Community Survey (ACS), where the difference in age distributions represents increased or decreased risk of having a confirmed case of COVID-19. As expected, adults over 50 are more at risk, and younger people (under 30) are less at risk. However, even adults from ages 31-50 seem to be at similar increased risk, matching reports that a majority of confirmed COVID-19 cases in California are under 50.
Reports suggest that younger people are more likely to experience milder symptoms when contracting COVID-19, sometimes even experiencing no symptoms at all. Therefore, as a note of caution when interpreting these data, this distribution could possibly suffer from more of bias due to limited testing than the other data depicted in this article. With limited testing capabilities, those with milder symptoms will likely be less represented in this age breakdown, meaning that the reduced risk of younger people may be overstated in SCC Public Health’s data. In South Korea, where testing capabilities are vastly increased, about 25.6% of confirmed cases were in their 20s as of July 26, compared to 19.4% of confirmed cases in Santa Clara County.
Daily Cases & Hospitalizations
Based on current data, we see that the average daily growth rate of confirmed COVID-19 cases in Santa Clara County is about 0.62% over the past week. Assuming exponential growth, confirmed cases will double roughly every 3.5 months at this rate. For the total count of COVID-19 cases in Santa Clara County to be growing exponentially, the percent increase of daily cases should be relatively stable (and nonzero) and the daily number of COVID-19 cases should grow exponentially. For it to be growing linearly, the percent increase should be diminishing to zero and the daily number of new cases should remain somewhat constant.
Given the rapidly changing nature of testing in the Bay Area and across the United States, the confirmed case counts and their growth might not be fully representative of how actual cases, including those that are unconfirmed, are developing. Confirmed cases can grow not only because of the spread of COVID-19, but also “as testing capacity increases” according to Santa Clara County Public Health. One way to analyze how active cases are growing is to analyze the growth of hospitalizations; one can assume that a certain, relatively constant, percentage of people who contract COVID-19 develop cases severe enough to require hospitalization. When analyzing the hospitalization growth rate, we see an average daily percent increase of about 1.6% over the past week in Santa Clara County. If COVID-19 increases stress on hospital capacities across the Bay Area, hospitalizations may incrementally become less representative of actual case growth in the Bay Area.
In the data we have thus far, we see that the daily percent increase of confirmed cases has been fluctuating around 1% from mid-April to early June, a significant decrease from prior growth rates. However, since the start of June, case growth has been growing. Still, cases reported by Santa Clara County Public Health do not encompass everyone who contracts COVID-19, so the case counts could be larger. In order to determine this, we unfortunately must wait to see at which rate cases are reported in the coming days as testing expands.
Testing
Santa Clara County Public Health began posting testing data on April 2. As of July 6, a total of 342,619 individuals have been tested, 332,565 of which have come out negative. Test rates must match the growth rate of the virus in order to properly document the number of cases in a given area. Looking at the daily increases of tests, early to mid-March showed signs of a quickly expanding testing infrastructure, increasing around 50% every day from March 6 to March 19. Testing increase rates then began steadily decreasing, with daily testing stalling at around 850 until mid-April. Through May and June, the daily number of tests has been growing, peaking at nearly 9,000 tests in late June. However, daily testing began stagnating in July.
If there exists a ceiling on how many tests can be administered in a given day, the resulting strained testing infrastructure will exacerbate how much of an underestimate reported cases in Santa Clara County are. Another sign of a strained testing infrastructure is a high positive cases to total tests ratio. The CDC recommends that among any COVID-19 symptom level, testing should be such that less than 10% of tests return positive results. Santa Clara County has been below this threshold since mid-April. The positive results per test ratio had been declining until mid-June, bottoming at about 1.1 positive cases per 100 tests.
With a high amount of positive cases per test, there is a higher likelihood that tests are being used for individuals with more obvious and progressed symptoms, leaving out those with mild or no symptoms. While such a strategy is an efficient use of a low amount of tests, it is also imperative to test, isolate and report asymptomatic individuals with COVID-19 since such individuals can “expose a far greater portion of the population to [COVID-19] than would otherwise occur” according to a March 16 study in Science by Li et al. According to SCC Public Health, their reported number of cases “represent only a small portion of the total number of likely cases in the county.”
As more cases develop and more data is collected, The Daily will continue adding analysis to this post tracking the local spread of COVID-19. In other areas affected by COVID-19, the number of cases has grown at an exponential, not linear, rate. Precautionary steps such as staying home, washing your hands, and practicing social distancing can reduce the overall growth rate and “flatten the curve.”
A previous version of this article mistakenly attributed the 43 cases from March 9 to March 8. Cases from March 14 were also collected too early in the day, meaning 79 total cases were reported instead of 91. This led to a misrepresentation of how cases grew the following day. The article also briefly labeled the data on the number of deaths by racial/ethnic group as data on the number of cases. The Daily regrets these errors.
This initiative was started by Dylan Grosz and is currently maintained by him, Arjun Ramani, Claire Huang, Daniel Ma, Georgia Sampaio, Hannah Park and Patricia Wei. Contact them at data ‘at’ stanforddaily.com.
Contact Dylan Grosz at dgrosz ‘at’ stanford.edu.