The context around recent Title IX developments and the Campus Climate Survey
The U.S. Department of Education recently announced new Title IX regulations on sexual misconduct for university campuses. The new regulations are thought to limit the responsibility of universities to investigate sexual misconduct complaints. Specifically, the regulations use a more narrow definition of sexual harassment, which limits the range of complaints that universities are required to take action on. Furthermore, if the alleged sexual misconduct did not occur in a school-sponsored event, universities are not required to address the complaint, among other changes.
In light of these new regulations, we investigated the results from the 2019 Association of American Universities (AAU) survey on sexual assault and misconduct to better understand the views and experiences of Stanford students compared to those at three other universities (Harvard, MIT and Ohio State University). We selected these peer institutions to form a mix of schools from different geographic locations, and also to cover both public and private institutions. While the survey is extensive, we will focus on showing the occurrence, perception and challenges still facing campus sexual assault and harassment, with Stanford being our focus.
Sexual harassment and assault at the University level
The AAU asked students whether they had, since entering college, experienced penetration or sexual touching involving physical force and/or inability to consent or stop what was happening (Table 3.1, 3.3, and 3.5 of the official report). At Stanford, 23.8% of undergraduate women responded yes, while at Harvard, MIT and Ohio State University, 24%, 18.4% and 24.9% responded yes, respectively.
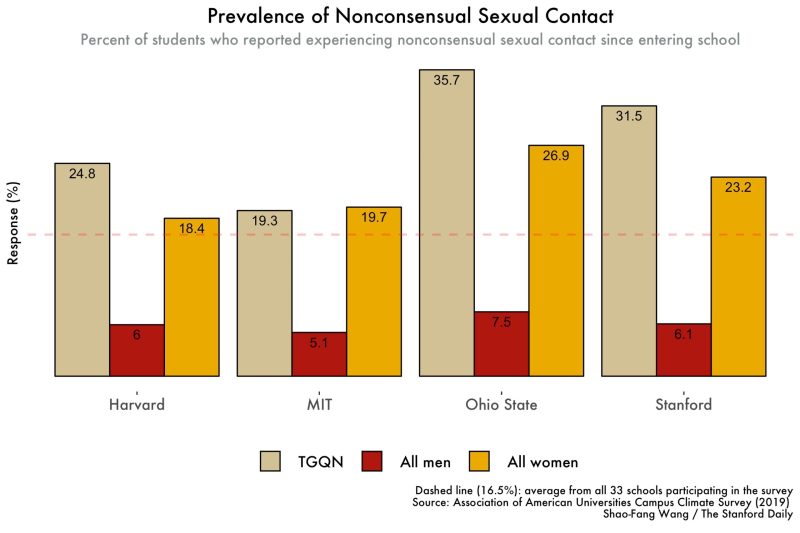
To assess the overall risk of nonconsensual sexual contact, the survey asked students whether they have experienced the following four tactics: penetration (completed or attempted) or sexual touching involving physical force, inability to consent or stop what was happening, coercion, or without voluntary agreement. Transgender woman or transgender man; nonbinary or genderqueer; questioning; or not listed (TGQN) students at Stanford reported a higher rate (31.5%) of nonconsensual sexual compared to all men and all women (Table 4.6 of the official report). This is almost 10 percentage points higher than the number reported by all women (undergraduate, graduate/professional students), and it is almost 25 percentage points higher than the number reported by all men at Stanford. The rates reported by TGQN students at Stanford are also much higher than those reported by TGQN students at Harvard (24.8%) and at MIT (19.3%).
Additionally, 72.5% of all TGQN students at Stanford reported that they had experienced at least one type of harassment behavior by a student, or someone employed by, or otherwise associated with Stanford. This is the highest rate among all student groups at the University and the highest rate of all four universities covered in this article.
Awareness of sexual misconduct and bystander behavior
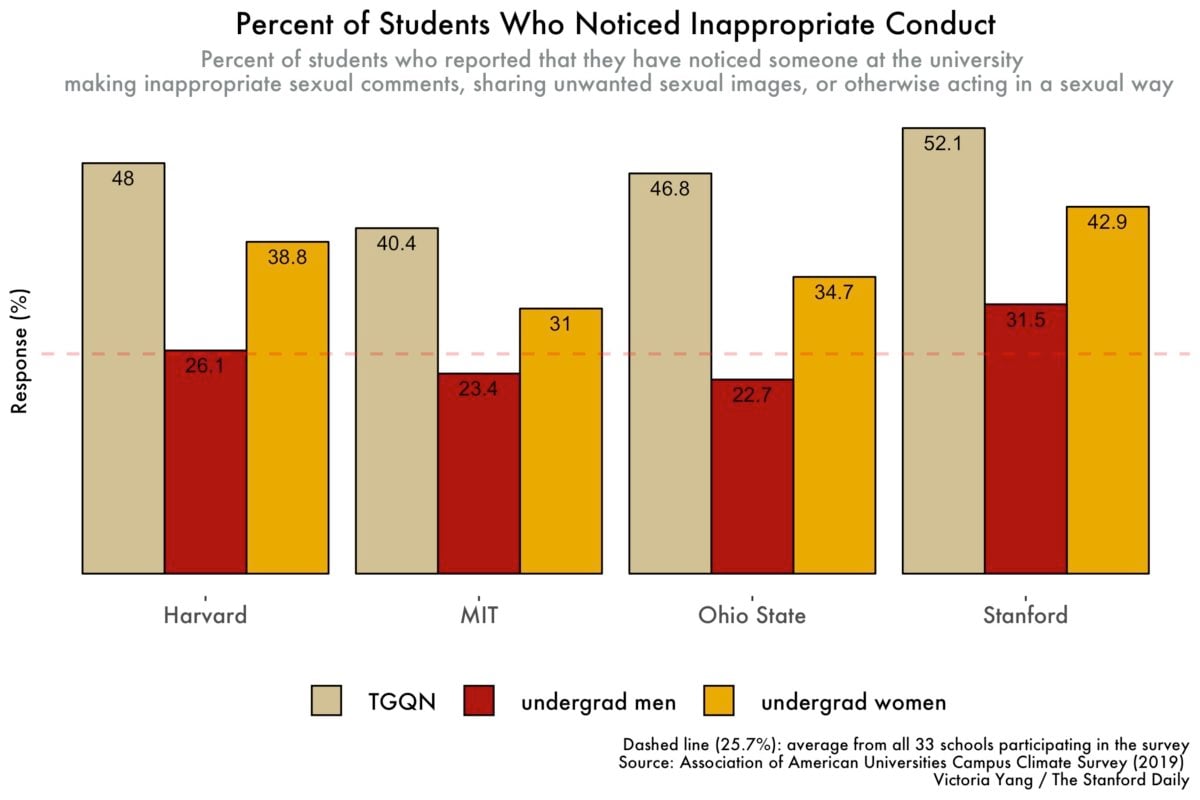
Students at Stanford reported having witnessed inappropriate sexual comments, sharing unwanted sexual images, or otherwise uncomfortable behavior at a much higher rate than students at peer institutions. At Stanford, 42.9% of undergrad women, 31.5% of undergrad men and 52.1% of all TGQN students reported having witnessed these occurrences. 38.8% of undergrad women at Harvard, 34.7% at Ohio State and 31% at MIT reported having witnessed these occurrences..
Furthermore, students were surveyed on whether they have witnessed a situation they believed could have led to a sexual assault. Compared with other universities, Stanford students were less likely to have reported witnessing such situations (20.3% averaged across the three categories, undergrad women, undergrad men, and all TGQN students) than Harvard students (23.2%), but more than MIT students (16.6%).
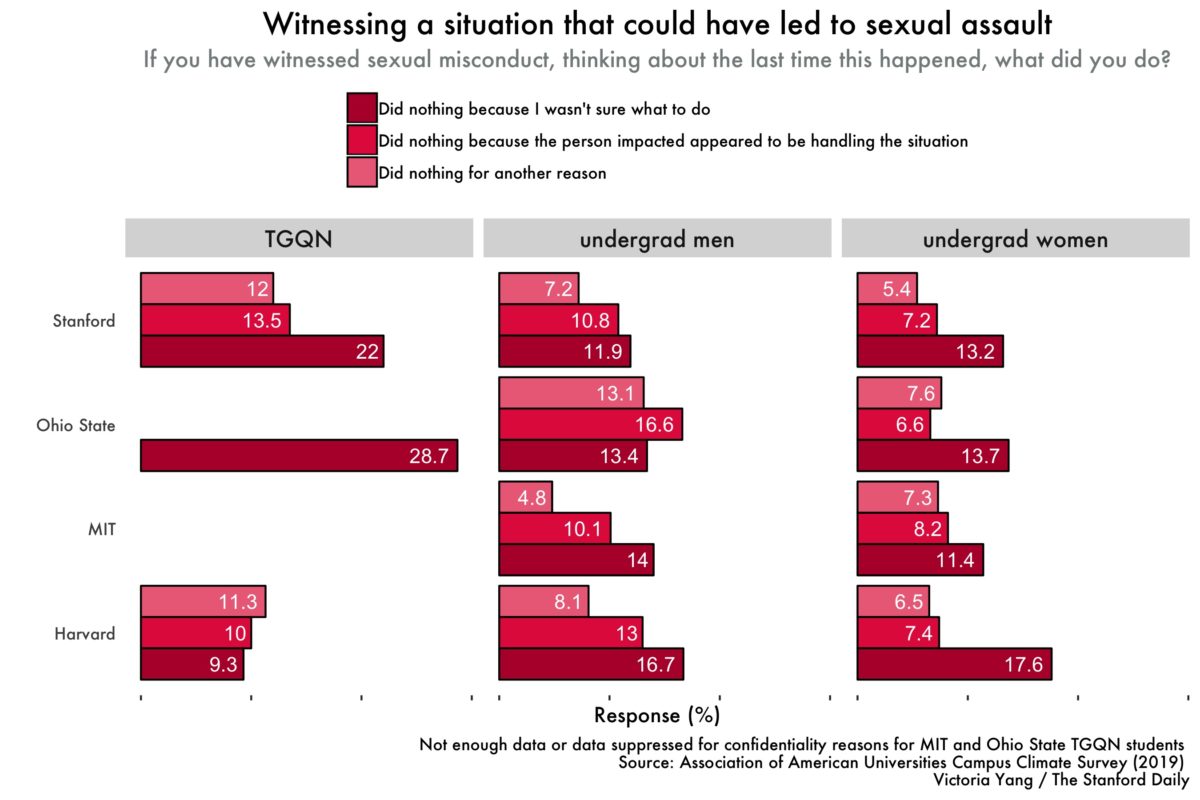
When students reported having witnessed uncomfortable, inappropriate situations or situations that they believed could lead to sexual assaults, they were further asked whether and how they intervened. The data suggests that although more than half of students reported having checked in with the person who seemed impacted by the behavior, a sizable portion reported doing nothing for various reasons.
Specifically, for situations that students believed could lead to sexual assault, 11-17% of undergrad students across the schools compared in this article reported that they “did nothing because I wasn’t sure what to do.” However, there is some disparity in the data on TGQN students (both undergraduate and graduate/professional) across schools. 22% of Stanford TGQN students reported that they “did nothing because I wasn’t sure what to do,” compared with 9.3% at Harvard and 28.7% at Ohio State. Some of MIT and Ohio State’s data on TGQN students were either not enough or suppressed, indicated below in the chart as an empty column.
Awareness of resources and reporting
Our analysis suggests that few students who experienced penetration or sexual touching involving physical force or inability to consent or stop what was happening respectively (i.e. incidents) contacted school-provided resources or programs. For incidents involving penetration or sexual touching involving physical force or inability to consent or stop what was happening respectively, 32.7% and 20.2% of women victims contacted a program. Men victims were 8.5 percentage points less likely than women victims to report to school officials after experiencing penetration involving physical force or inability to consent or stop what was happening. When interpreting this data, it is important to note that individuals may have reported multiple incidents and the percentages reported here are over all such incidents.

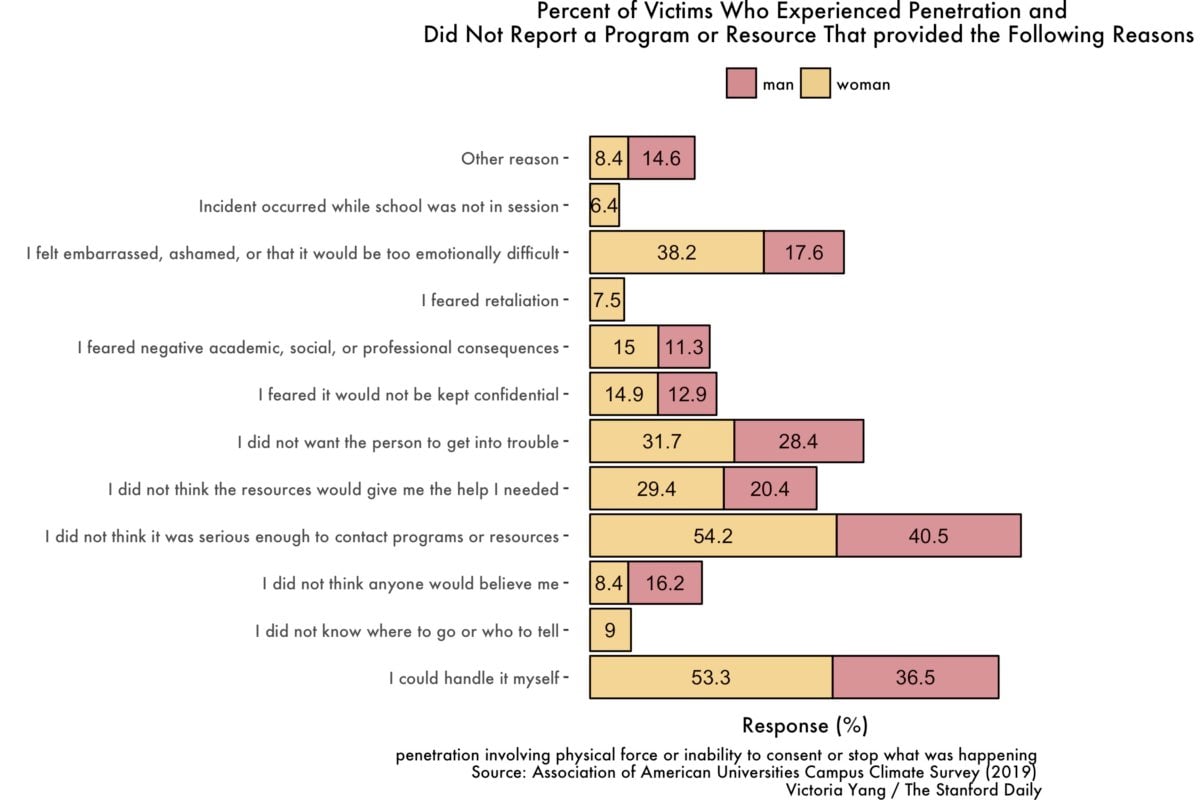
Surveyed victims who did not report their experience provide a variety of reasons for choosing not to report. For incidents involving penetration, 54.2% of women victims and 40.5% of men victims reported that they did not think it was serious enough to contact programs or resources; 38.2% of women victims and 17.6% of men victims reported that they felt too embarrassed, ashamed or emotionally difficult; and 53.3% of women victims and 36.5% men victims reported that they could handle it themselves.
Additionally, surveyed victims who did not report also reported a lack of awareness of, and having trust concerns with, programs and resources. In 9% of the incidents involving women victims, respondents reported they did not know where to go or who to tell, 14.9% of respondents worried about confidentiality, and 29.4% of the victims did not believe that the resources would give them the help they needed. For incidents involving men victims, 12.9% of victims worried about confidentiality and 20.4% of the victims did not believe that the resources would give them the help they needed.
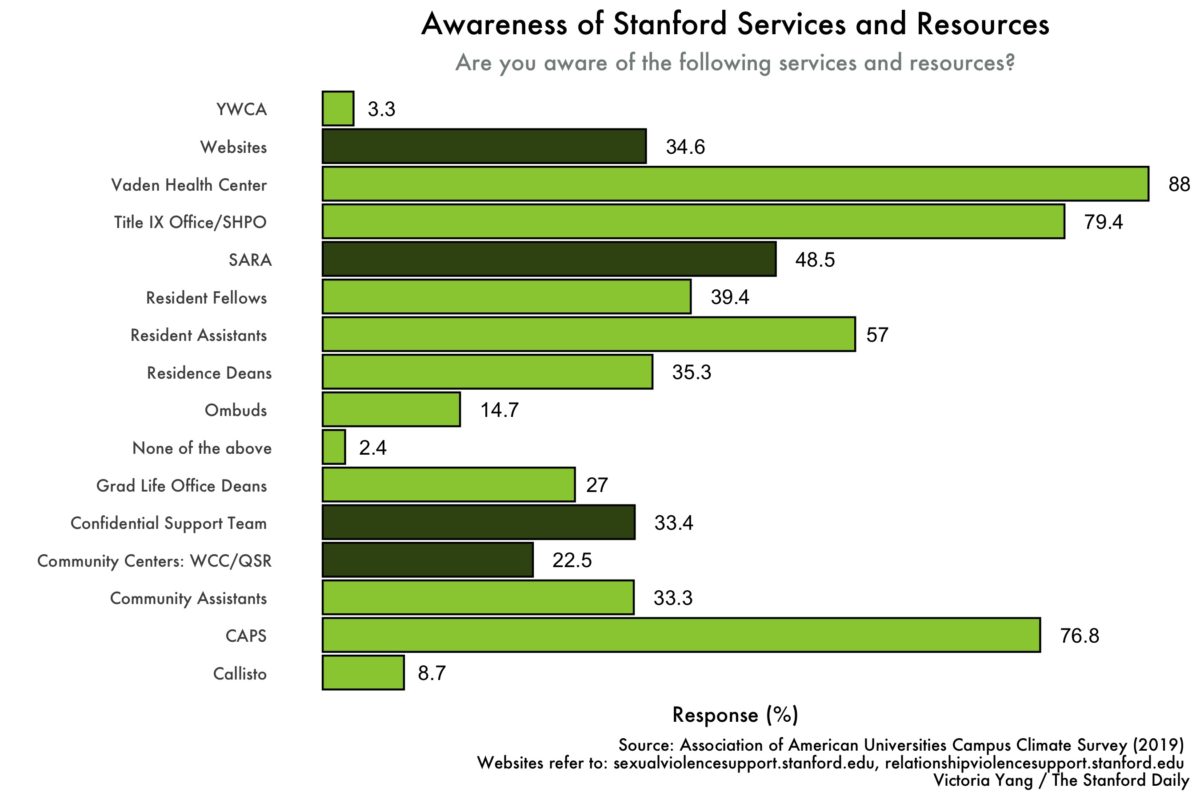
At Stanford, different resources had different levels of awareness. 79.4% of respondents reported knowing of the Title IX office, but less than half of students knew about the SARA office (48.5%). An even smaller number of students were aware of other support resources such as the Women’s Community Center and the Queer Student Resources center (22.5%), website resources (34.6%), the confidential support team (33.4%) and many others.
Apart from awareness of resources and programs related to sexual assault and misconduct, there is also room for improvement in students’ awareness of what happens after a report is made. 52.2% of Stanford students reported they were “not at all” (22%) or “a little” (30.2%) aware of what happens with reports of sexual misconduct. Stanford students were comparatively less knowledgeable around reporting than Harvard and MIT students, but were more aware than students at Ohio State.
TGQN students
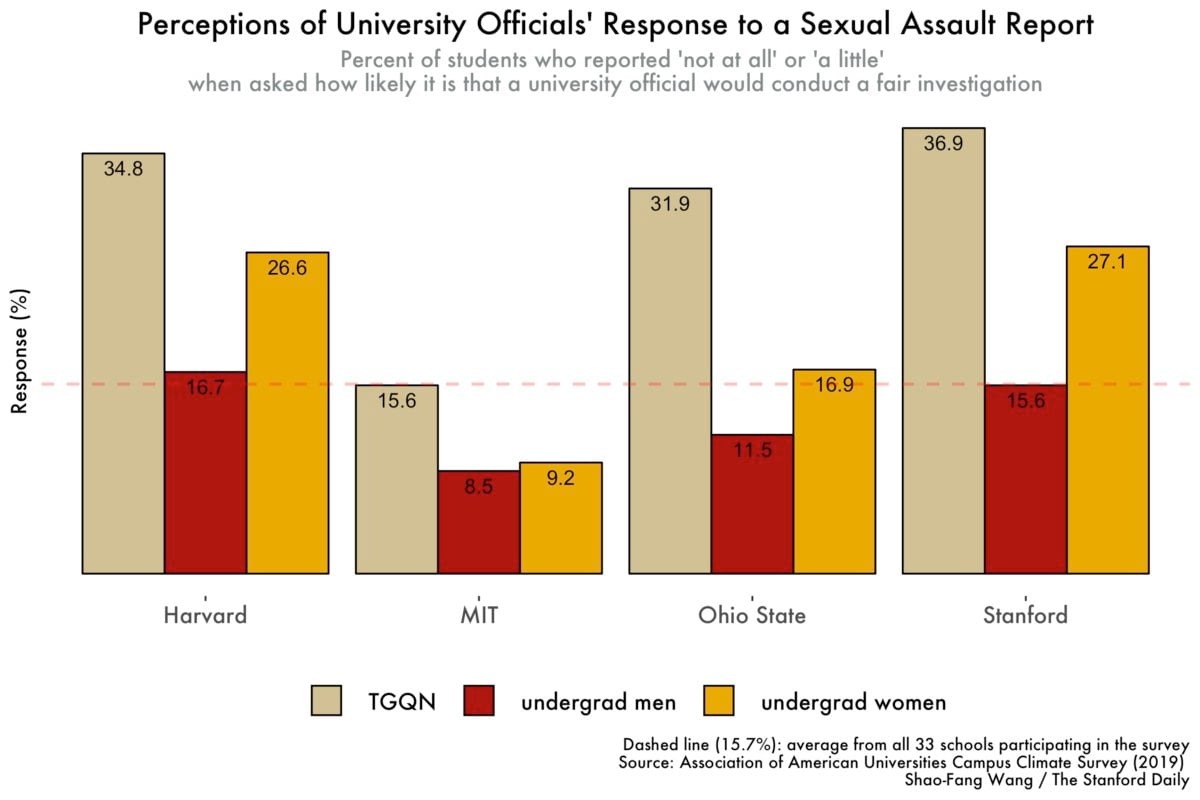
In addition to reporting high rates of nonconsensual sexual contact and harassment behavior, TGQN students reported the least trust in the school officials’ handling of sexual misconduct issues. When asked how likely it is that campus officials would conduct a fair investigation of a sexual misconduct report, 36.9% of all TGQN students at Stanford responded “not at all” or “a little.” This number is more than double the number reported from TGQN students at MIT (15.6%) and is the highest across all student groups from all four universities.
Finally, TGQN students at Stanford were similarly or more knowledgeable than other students about official resources and services related to sexual assault or other sexual misconduct. Around 42% of TGQN students reported that they were “very” or “extremely” knowledgeable about how to get help at school if they or a friend were victims of sexual assault, compared to 37% of undergraduate women and 34.3% of undergraduate men.
Overall, TGQN students experienced sexual misconduct at high rates and had the least trust in the school officials’ handling of these issues. In addition, they were very knowledgeable with on campus resources for handling sexual misconduct.
Looking Forward
The AAU Campus Climate Survey 2019 surfaced important challenges around campus sexual assaults and misconduct before the release of the new Title IX regulations. The new regulations have narrowed the definition of sexual misconduct, strengthened the rights of the accused and given schools the flexibility to choose a higher evidentiary standard, establish an appeals process and offer the option of cross-examination. These developments may pose further challenges to curtailing sexual misconduct. Specifically, in this article we have highlighted the high prevalence of sexual misconduct on Stanford’s campus, room for increasing trust in Stanford officials and awareness of resources and reporting, and challenges faced by TGQN students. Therefore, Stanford should follow a higher standard, particularly in light of the various areas of improvement we have identified, and strive to make the university experience a safe one for all.
Methods and Limitations
The Association of American Universities (AAU) assembled 33 schools to participate in the 2019 Campus Climate Survey. It was administered online, and all undergraduate, graduate and professional students who were 18 years or older were invited to complete the survey.
The Campus Climate Survey was launched at Stanford in April of 2019. 62% of students provided enough information to be included in the survey results. A statistical weighting procedure was performed to allow the sample to reflect the overall population distribution. Data used in this article were gathered from the AAU’s official report.
Recently, Stanford released new data on alcohol and drug use, as well as a new analysis on the AAU Survey. A presentation of the new data covers sexual harassment students experienced, segmented by gender and by campus community (NCAA athelete, fraternities/sororities), as well as alcohol and drug use, level of contacting resources and programs and location of incidents.
The gender groups used in the report were based on self-reported gender identity. Respondents were asked to choose among eight response options that best described how they identified themselves and then were classified into one of four groups: woman, man, TGQN (transgender woman or transgender man; nonbinary or genderqueer; questioning; or not listed), and decline to state.
The official reports released by the AAU only include aggregated data for each school. Individual data points were not accessible to the public.
Additional coverage related to the Campus Climate Survey can be found here.
This article has been corrected to reflect the fact that numbers in the first chart comparing prevalence of nonconsensual contact were for all men and women men not for undergraduate men and women. The article has also been updated to explicitly state the four tactics falling under the broader category of nonconsensual sexual contact. Furthermore, the article now explicitly states that students are included in the set of people associated with Stanford who had harassed others. The article has also been updated to correct the percent values in the chart titled ‘Witnessing a situation that could have led to sexual assault.’ In addition, the article now specifies that certain data on individuals reporting or not reporting their experiences is specifically limited to victims of sexual misconduct. A previous version of this article incorrectly stated TGQN students made up the highest percentage of students who had experienced sexual misconduct. It has been changed to state that TGQN students experienced sexual misconduct at high ratesThis article has been corrected to reflect the fact that numbers in the first chart comparing prevalence of nonconsensual contact were for all men and women men not for undergraduate men and women. The article has also been updated to explicitly state the four tactics falling under the broader category of nonconsensual sexual contact. Furthermore, the article has been updated to state that students are part of the group of those associated with Stanford who had harassed others. The percent values in the chart titled ‘Witnessing a situation that could have led to sexual assault’ have been corrected to precisely match the original AAU report. In addition, the article has been corrected to specify that certain data on individuals reporting or not reporting their experiences is specifically limited to incidents involving sexual misconduct. A previous version of this article incorrectly stated TGQN students made up the highest percentage of students who had experienced sexual misconduct. It has been changed to state that TGQN students experienced sexual misconduct at high rates.The title of reasons for not reporting chart has been updated to include the phrase “Reasons for not reporting to a program or resource.”
The Daily regrets these errors.
Contact Victoria Yang at yaqingy ‘at’ stanford.edu and Shao-Fang Wang at shaofang ‘at’ stanford.edu.
