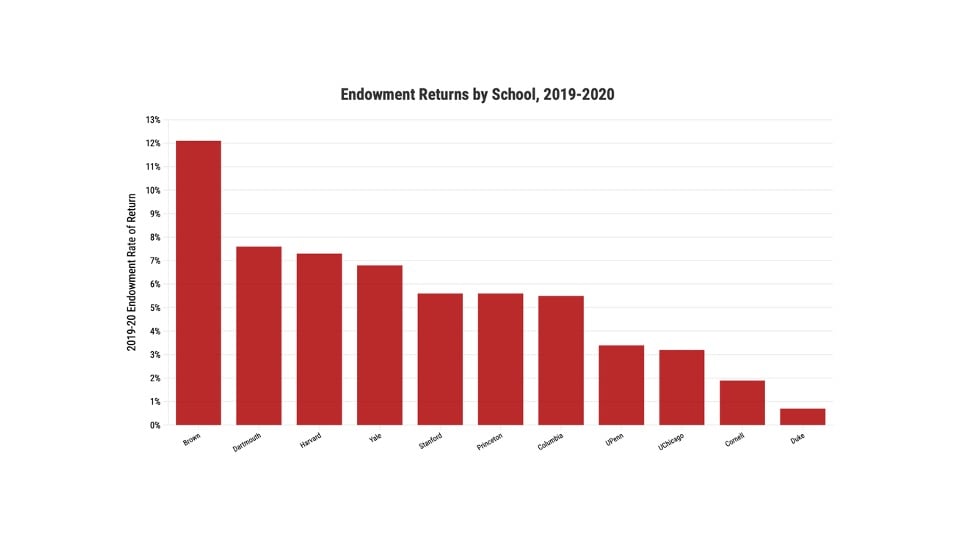
Stanford recently released its annual endowment returns for the 2019-20 year, netting $1.6 billion in investment gains with an overall return rate of 5.6%. But what do these numbers actually indicate about the endowment’s overall performance? To answer this question, The Daily compared the University’s performance to those of its peer institutions and consulted experts familiar with Stanford’s endowment.
First, it’s important to know how Stanford actually invests its endowment. Robert Wallace, CEO of Stanford Management Company (SMC), which manages the University’s endowment, shed light on the process.
Wallace stressed that “Stanford Management Company is not really a company at all.” “We are a division of the University,” he wrote in a statement to The Daily, adding that the company is “staffed by people that strongly believe in Stanford’s academic mission and work very hard to contribute to it.”
Most of the funds SMC manages come from the University’s Merged Pool, which is now worth $30.3 billion. Each year, SMC invests a certain amount of the Merged Pool in stocks and bonds with a 70/30 portfolio, meaning that approximately 70% of investments are based in the United States, while the other 30% are made internationally.
“The 5.6% return rate that was reported for this most recent year exceeds the median endowment performance of 1.6% for the year, and the top quartile endowment performance of 3.7% for the year,” Wallace wrote. He added that SMC deducts “all internal and external costs and fees from our reported results, while the vast majority of the peer universe does not.”
In 2015, SMC started making changes to investments in hopes of increased returns, “rebuilding more than 80% of the investment portfolio,” Wallace wrote. “This work, which has been a considerable undertaking given the size and illiquidity of the portfolio, has already helped elevate our results.”
Wallace noted that SMC’s changes have also positively affected the school’s rankings: Based on five-year performance, the school used to rank “11th out of the top 20 largest endowments.” In the last five years, however, the University’s endowment has grown and is now “fifth out of the top 20 largest endowments.”
The figure below shows top returns from some of Stanford’s peer institutions. Brown, Dartmouth, Harvard and Yale all outperformed Stanford, placing the University fifth in return percentage.
Overall, Wallace believes the endowment is “performing strongly overall” and wrote that he believes SMC “handled the market volatility of the pandemic well.”
While Wallace noted the success of this year’s returns, he also emphasized that “longer-term results,” specifically five- and 10- year returns, “help us provide material ongoing support for the operating budget and still preserve the ‘purchasing power’ of the endowment so that it can provide similar benefits to future generations of students and scholars.”
At this point, you might find yourself asking the following questions:
Why is Stanford’s budget facing any stress at all? If we have $30.3 billion dollars sitting in the bank, will we ever run out of money? Why not just use endowment funds whenever possible?
Board of Trustees Chair Jeff Raikes ’80 elaborated on the ways in which the endowment can be used. He said that the endowment is “not a savings account” and must be “wisely invested,” referring students to an article about endowment usage.
Raikes wrote that “significantly ‘dipping into the capital’ will decrease the capital base and reduce the overall returns” that fund the University both “now and in the future.” He added that “only a small portion is an emergency fund or buffer for extraordinary circumstances.”
Christopher Phillips, head of institutional advisory services at Vanguard, provided an external opinion on Stanford’s returns to The Daily. Vanguard is an investment management company that presently holds about $6.2 trillion in global assets.
Philips wrote that evaluating Stanford’s performance is mainly “a matter of context,” and provided external statistics about the worldwide average of all 70/30 portfolios.
“For the 12 months ending June 30th, the same performance period that university endowments utilize, a globally balanced 70/30 portfolio returned 4.9%. Of the 33 endowments that have reported so far this year, that ranks #16.” Because most universities also use 70/30 or 60/40 portfolio splits, this overall average is used as a common benchmark to compare school endowments.
These numbers demonstrate that Stanford’s yearly return of 5.6% does in fact outperform the global average, placing it among the highest-performing universities in the peer universe. Wallace also wrote that “over the last 10 years, the 70/30 portfolio returned 9.1%, while the Stanford endowment returned 9.3%.” Though Stanford’s 10-year return is above average, the University’s endowment does not stand out as much when compared to the endowments of top peer institutions as seen in the chart below.
But is the complexity and cost of 70/30 portfolios (or 60/40 for many schools) worth it? According to Phillips, “every endowment office” should be asking questions like these.
“For those endowments underperforming the 70/30 it’s a really important question,” Philips said. “For those like Stanford, it’s easier to justify those expenses and complexity. Given everything that has happened this past year, outperformance, even slight outperformance, should be celebrated.”
Contact Benjamin Zaidel at bzaidel ‘at’ stanford.edu.
